
Metric Terminology
Network Latency
The one-way (source to destination) or round-trip (source to destination and back) delay, measured in milliseconds (ms).
Network Jitter
The variation in delay between when packets are transmitted and when they are received.
Packet Loss
The percentage of packets that were transmitted but not received by the destination, out of the total number of packets sent.
Network Availability
The inverse of packet loss: the percentage of packets transmitted and successfully received, out of the total number of packets sent.
Network Latency Grid
The Network Latency Grid page shows the latest one-way latency between every pair of markets. Source markets are listed down the left side and destination markets across the top. The grid refreshes automatically every 5 minutes.
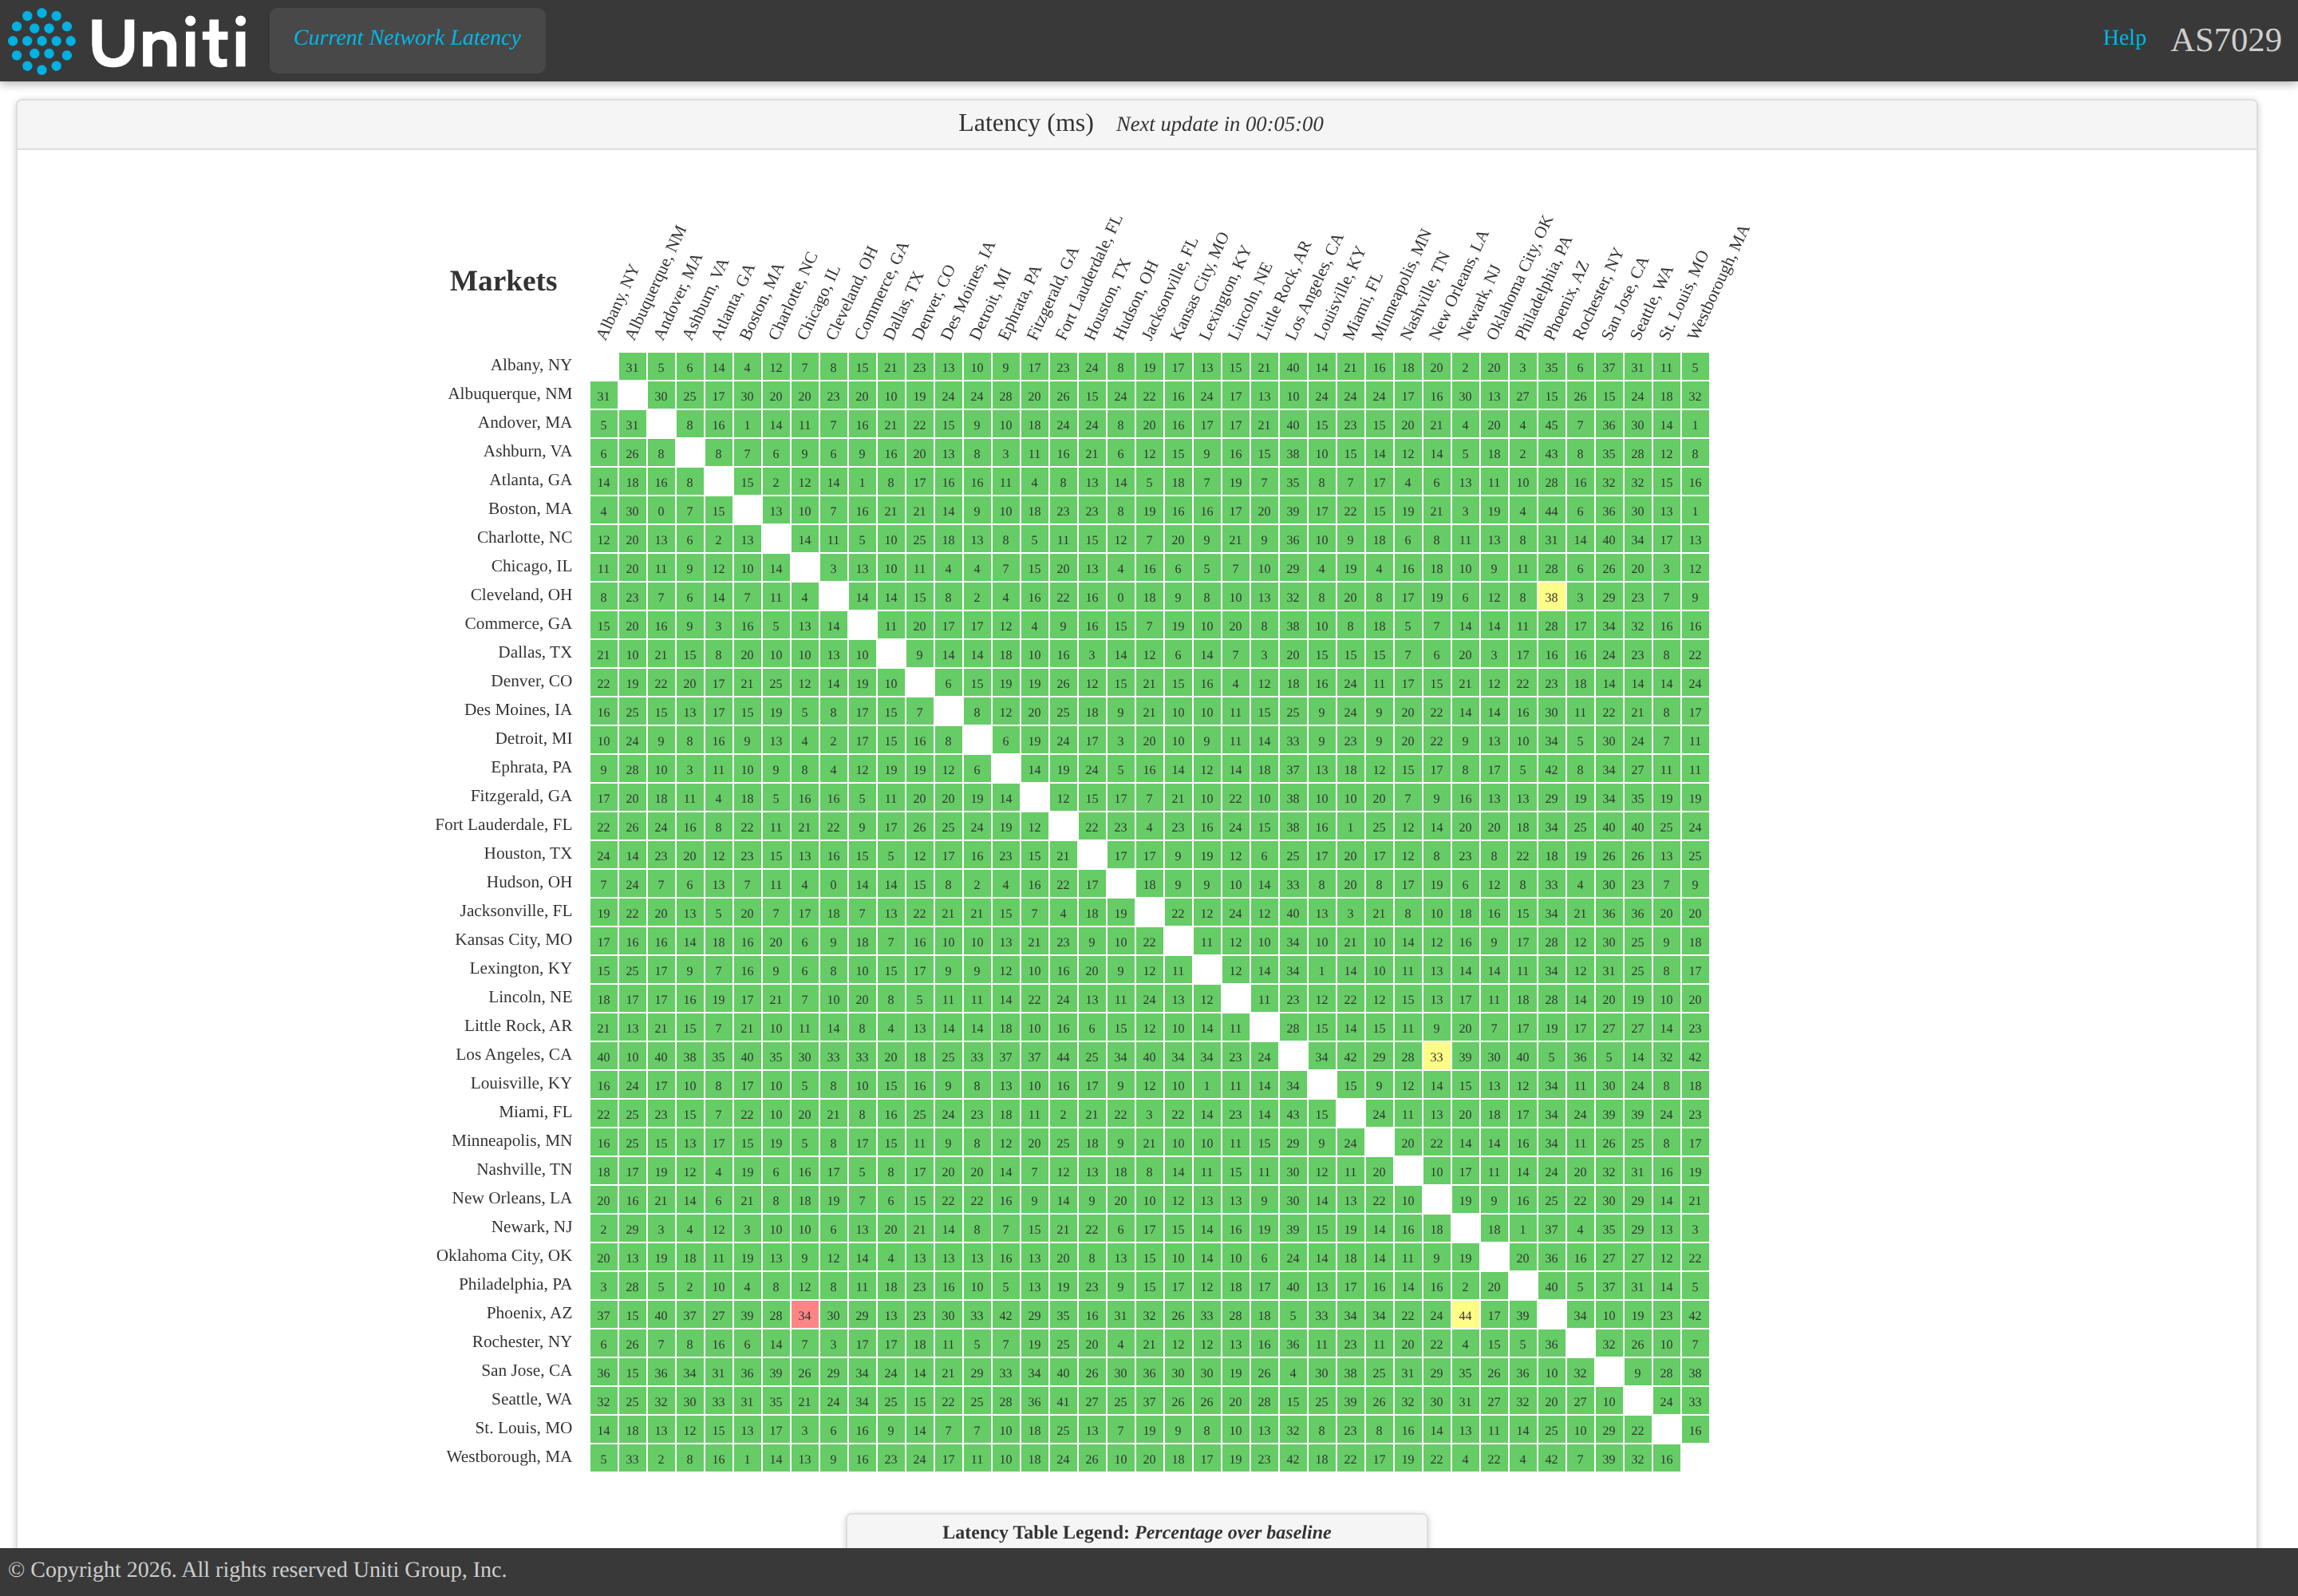
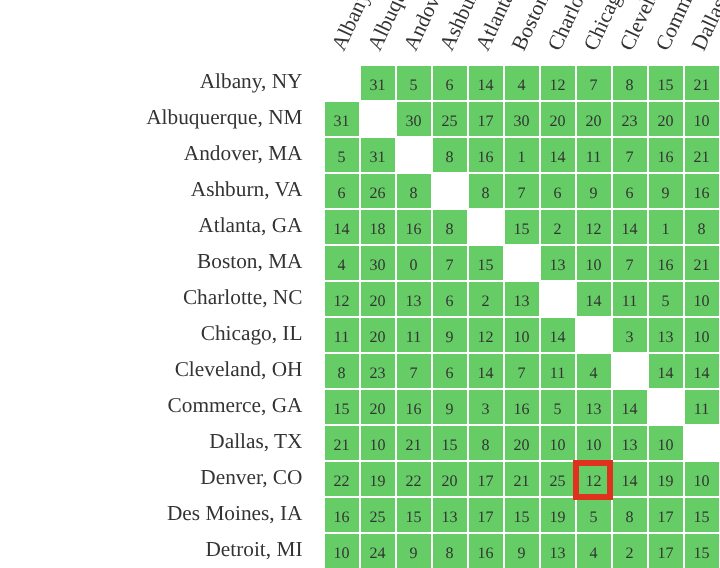
Find a market pair. Each box holds the one-way latency from the source market (row) to the destination market (column). In the example below, the latency from Denver to Chicago is 12 ms.
Grid colors
Each box is colored by how far the current latency is above that path's baseline latency:
Metric details
Hover over a box to see latency, jitter, packet loss and availability for each QoS queue, in both directions (A to Z and Z to A), along with the round-trip time and the baseline latency.
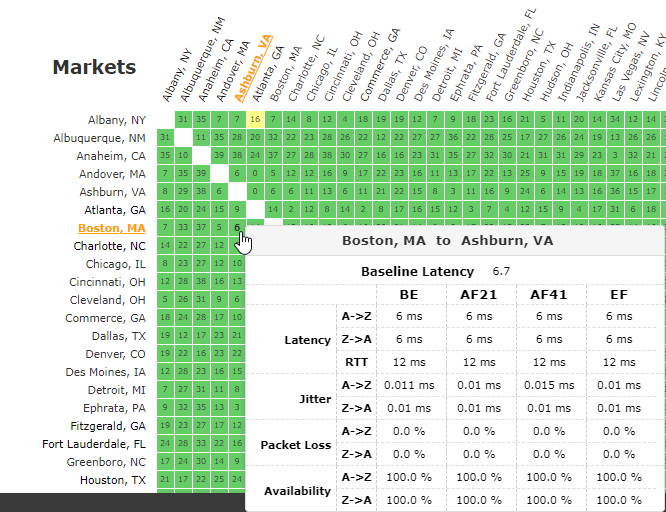
Click a box to open 7 days of historical data for that market pair in a new tab.
QoS queues
| Queue | Traffic class |
|---|---|
EF | Realtime |
AF41 | Mission Critical |
AF21 | Business Critical |
BE | Standard Data |
Network Latency Historical Data
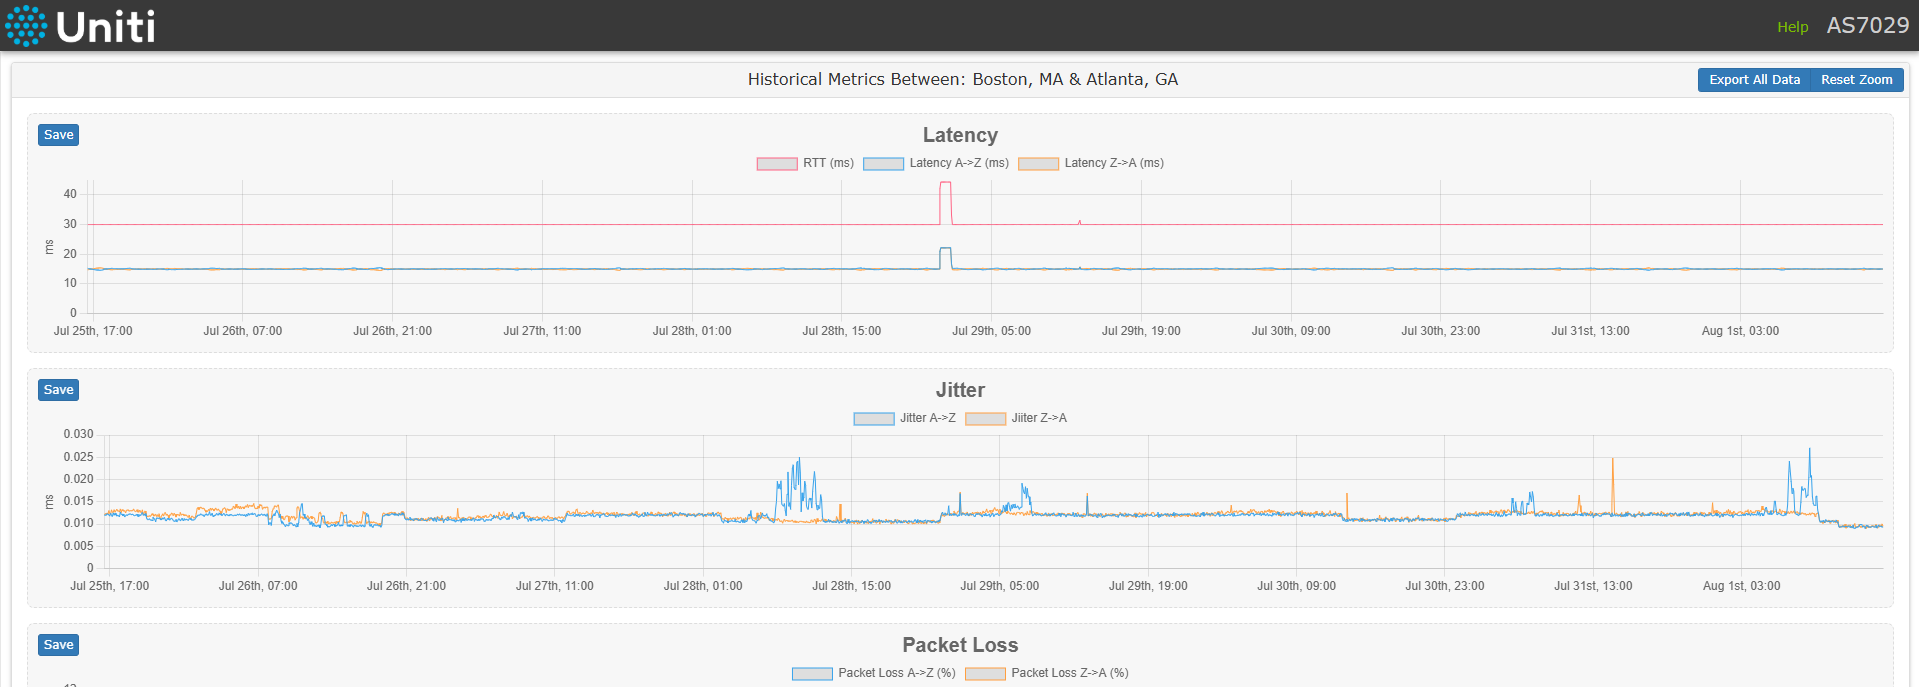
The historical data page charts 7 days of latency, jitter and packet loss for one market pair. To open it, click any box on the latency grid. All times are shown in UTC.
Zooming
Click and drag across a chart to select the time range you want to zoom in on.
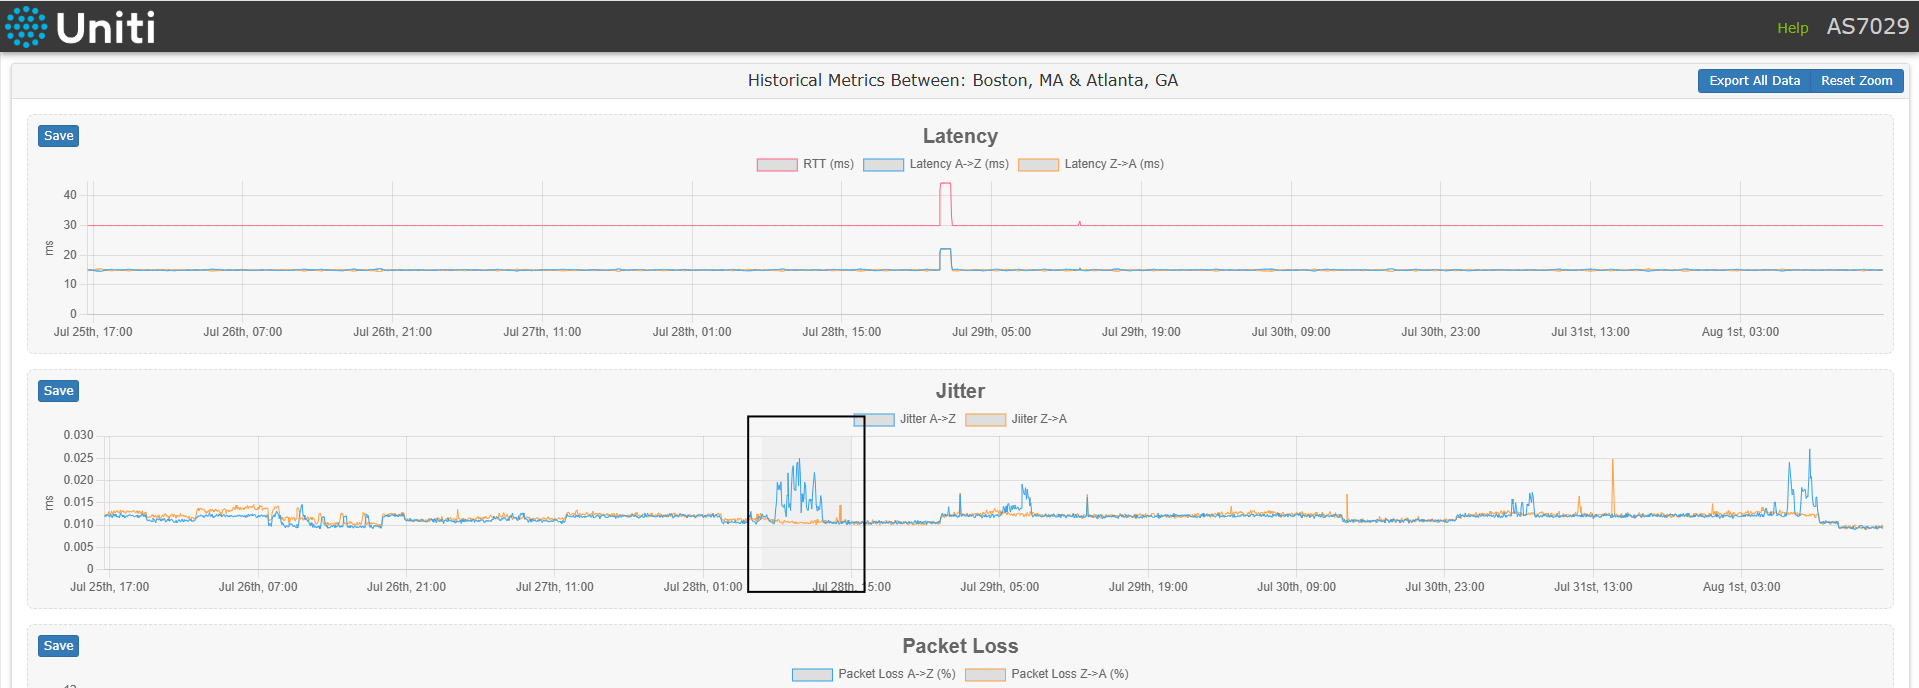
Release the mouse and the chart zooms to the selected range. You can zoom in again as many times as you like.
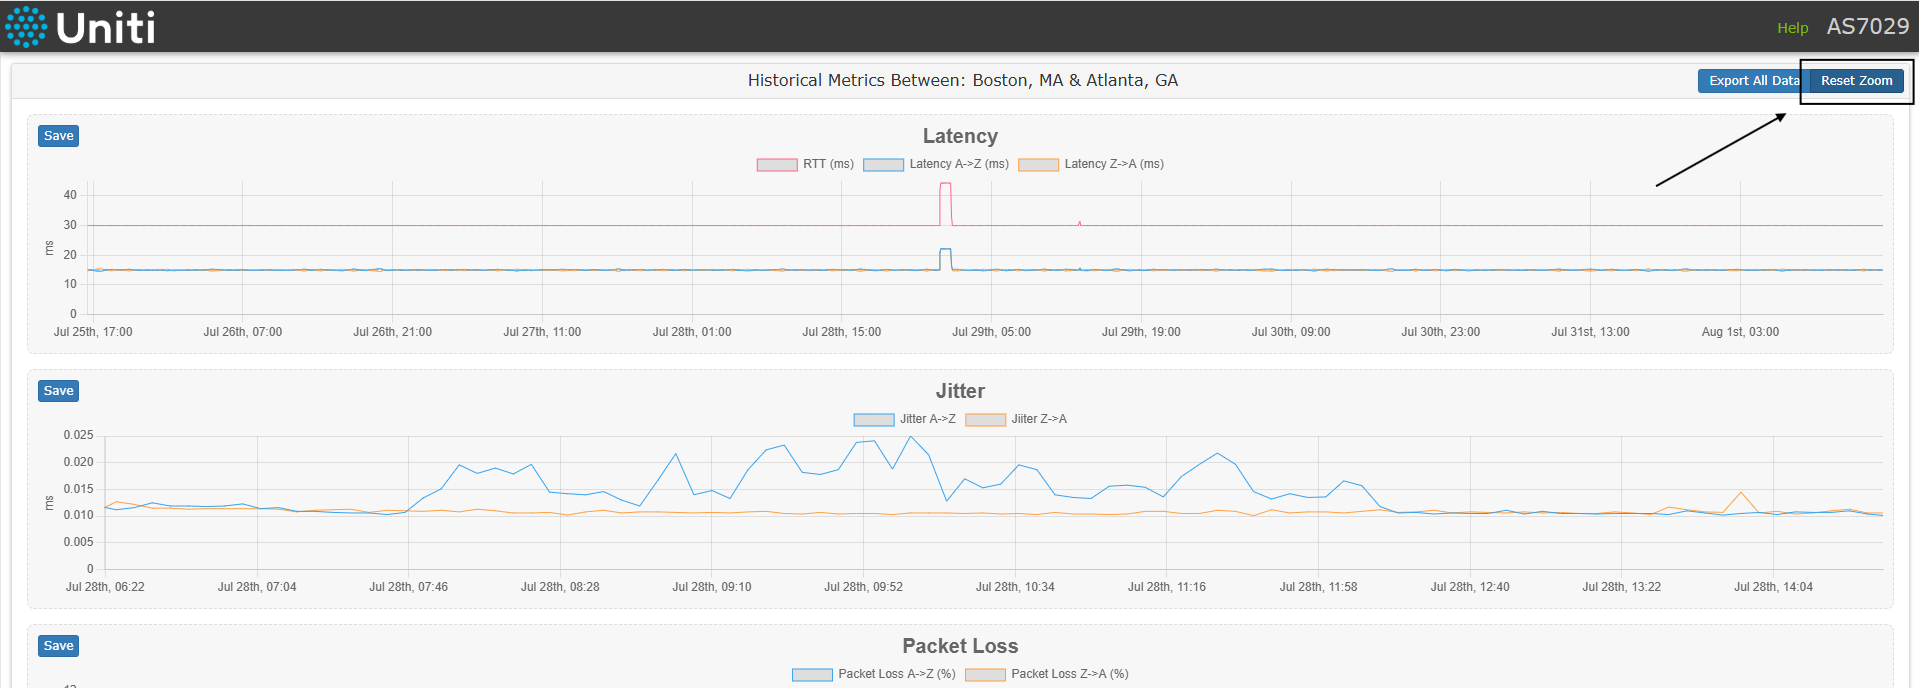
Zoom back out by clicking Reset zoom in the top right corner, which resets every chart, or double-click a chart to reset just that chart.
Chart tools
Move the mouse over a chart to see the exact values for every series at that point in time.
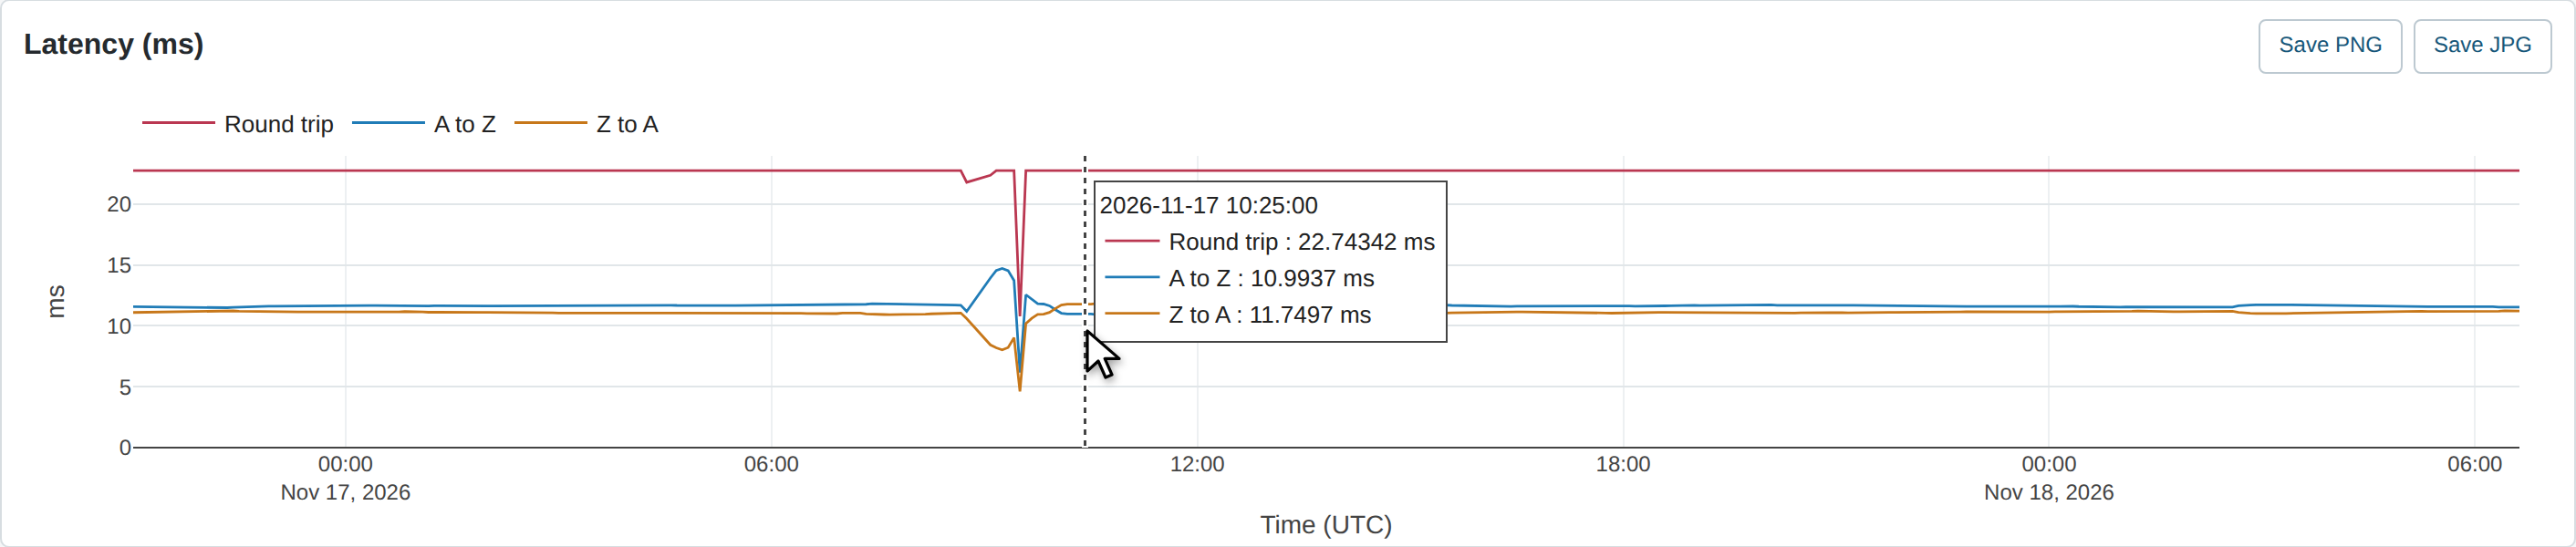
- Show or hide a seriesClick a legend entry, such as Round trip, to hide or show that line. Double-click an entry to show only that line.
- Save a chart imageSave PNG or Save JPG downloads the chart as it is shown, including your zoom and hidden series.
- Export the dataExport all data (CSV) downloads all 7 days of measurements for the market pair as a spreadsheet-friendly CSV file.
A to Z is the direction from the source market (the grid row) to the destination market (the grid column). Z to A is the reverse direction.